About
Hello! My name is Catarina and I am currently embarking in my next academic challenge undertaking a Master's degree in Engineering Physics. Here you can read about one of my most recent projects.
Medical Image Reconstruction Project
In 2021 I was presented with a challenge: develop a project, all by myself, on a topic I liked! I immediately thought about using the knowledge I had gained in my bachelor’s degree and apply it to one of my passions, biomedics.
I ended up choosing medical Image Reconstruction as my project. I chose it since developing new mathematical tools to treat and vizualise data is really important nowadays to improve disease diagnosis and study the human body and brain.
Knowing nothing about this topic I soon started investigating on how medical images were being produced. I discovered pretty quickly that the mathematical basis was the discrete Fourier Transform. Of course a straightforward implementation could be readily made: imagine we start with a complex sequence of lenght n; to perform its transform we simply compute n sums, each of length n. But this was too slow of a computation: n squared operations.
Cooley-Tukey FFT
The next step was to investigate how to optimize this computation. I found out we can make use of Fast Fourier Transform (FFT) algorithms. The most common FFT is the Cooley-Tukey algorithm. It consists on a divide and conquer algorithm such that the lenght n transform is replaced by two transforms of lenght n/2.
Two different Implementations
I implemented two methods: a recursive and an iterative algorithm. The recursive algorithm needed O(n) function calls to itself. These calls can be replaced by an iterative algorithm.
The idea for this last method lies on swapping elements whose indices are binary reversals. First we swap the mutual reversals: for example, the element in position 1 (001 in binary) winds up in position 4 (100 in binary). Elements whose index is the same reversed stay put, like index 2. Then we merge adjacent sublists where every sublist represents the half-size transform of the even or odd part of the full size transform.
2D FFT
All these methods were tested in 1-dimensional data sets using MATLAB. Next I focused on a 2-dimensional FFT. The 2-dimensional transform can be computed by applying 1D transforms. Let’s assume we have a 2D array. We can treat this array as an N1xN2 matrix. Then it is as easy as applying a 1D transform first on the rows and then on the columns - row-column algorithm.
Graphic Interface
I then built a graphic interface that can be used to import raw k-space data files, perform the FFT for 1 and 2 dimensional data and visualize the results. You can see below the general aspect of this interface:
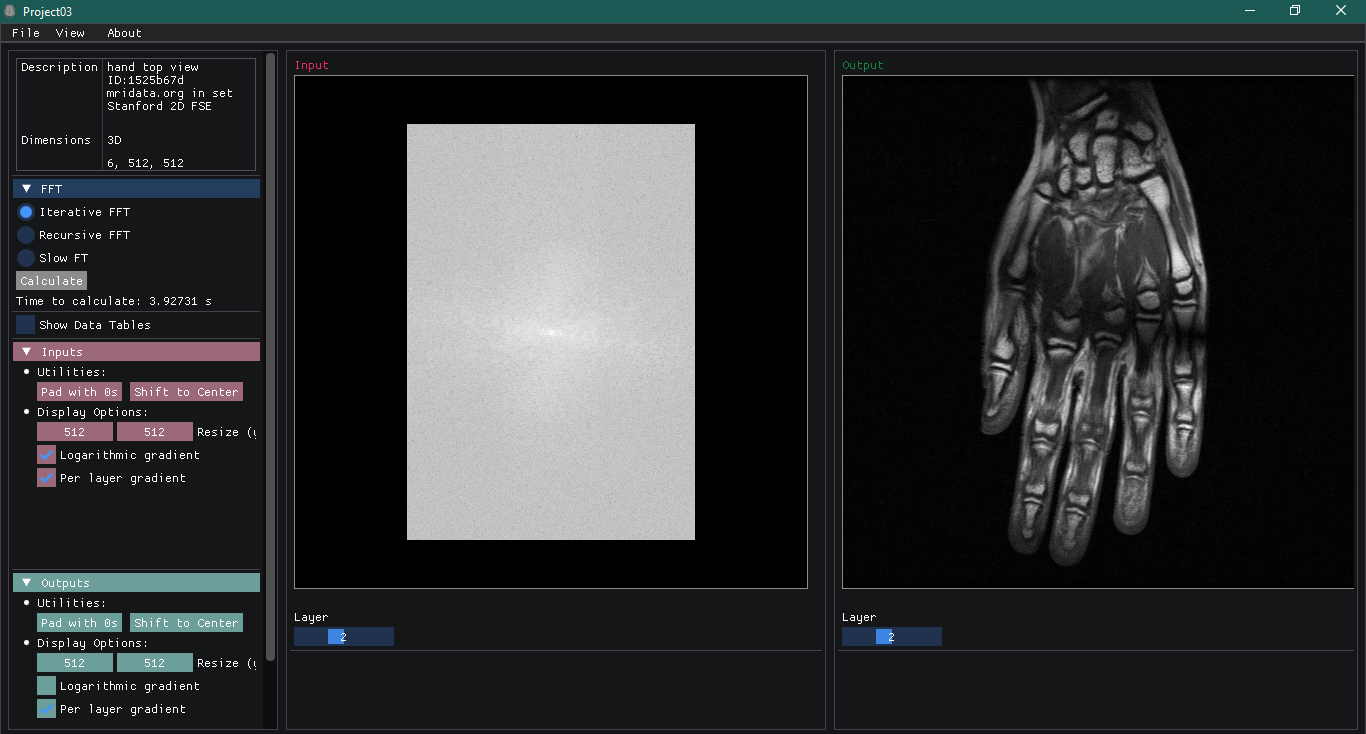
There are three main panels: one containing all the tools necessary to operate the program (on the left), another showing all the Input information (middle section) and an Output panel that will show the resulting images.
It is really easy to use:
- File -> Open data file
- Modify your Input data as necessary
- Select the FFT algorithm you wish to use
- Calculate!
Input Modifications
There are important things to be considered regarding the input data.
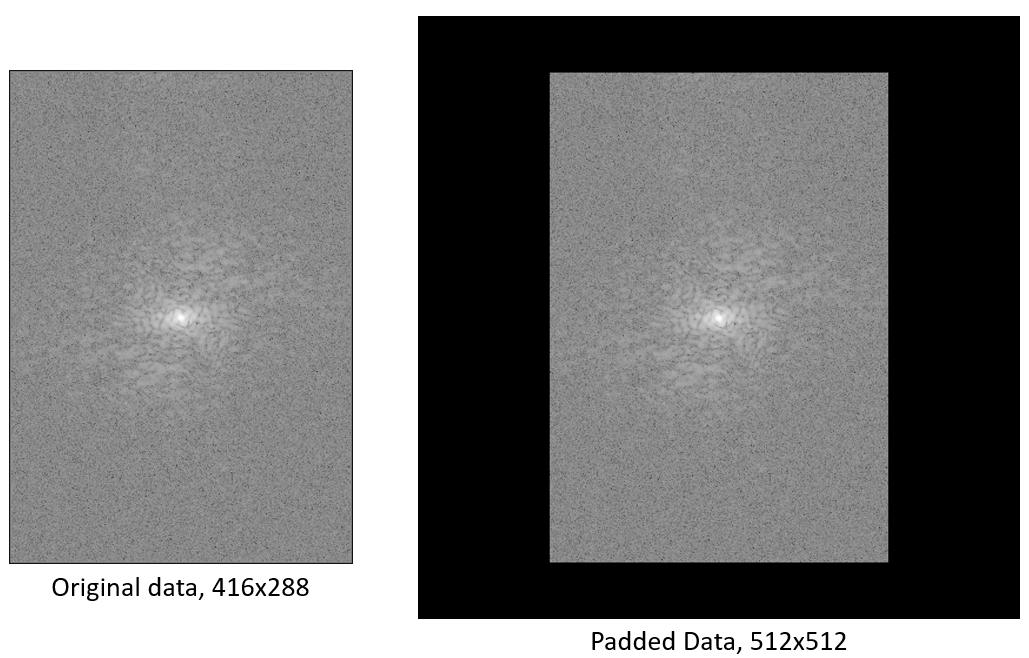
First notice that the left panel will show a description of the file opened and data dimensions. For both recursive and iterative implementations the data size should be a power of two. If that is not the case you should use the ‘Pad with 0s’ option.
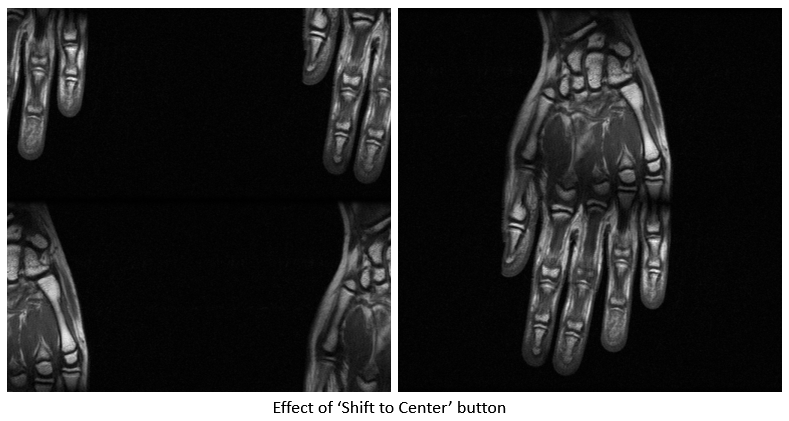
Also, if your input file does not have the zero frequency centered, the output will appear in the corners and we don’t want that. For that purpose there is a ‘Shift to Center’ option.
Other options
The ‘Display Options’ allows the user to resize the input image (in x and y) and control the contrast with the ‘Logaritmic gradient’ and ‘Per layer gradient’ checkboxes. The later makes the color space only consider the current layer values instead of the whole domain.
Finallly, one can choose to show or hide the tables with numerical data - ‘Show Data Tables’ checkbox.
All these options are also available in the Output section.
Results
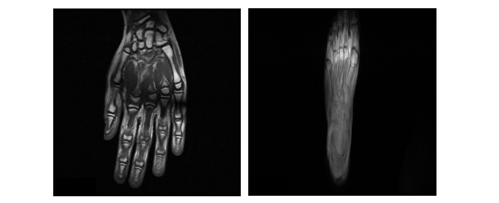
I tested with several frequency data obtained from open sources. Here are some the reconstruction results!
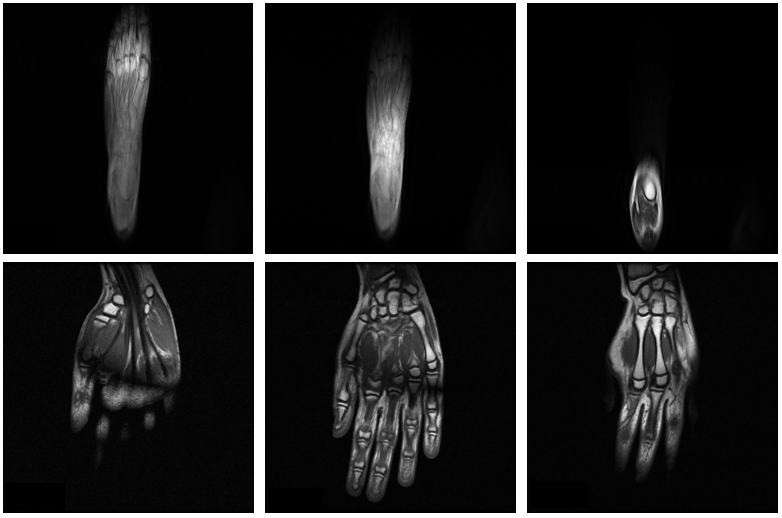
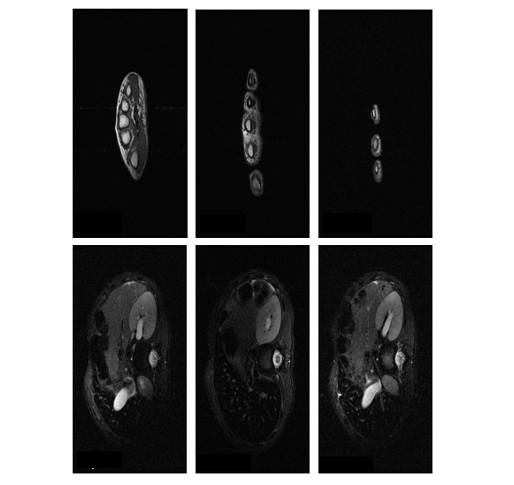
Data taken from mridata.org.